Client, Year
Personal, 2023
Tool
Tableau
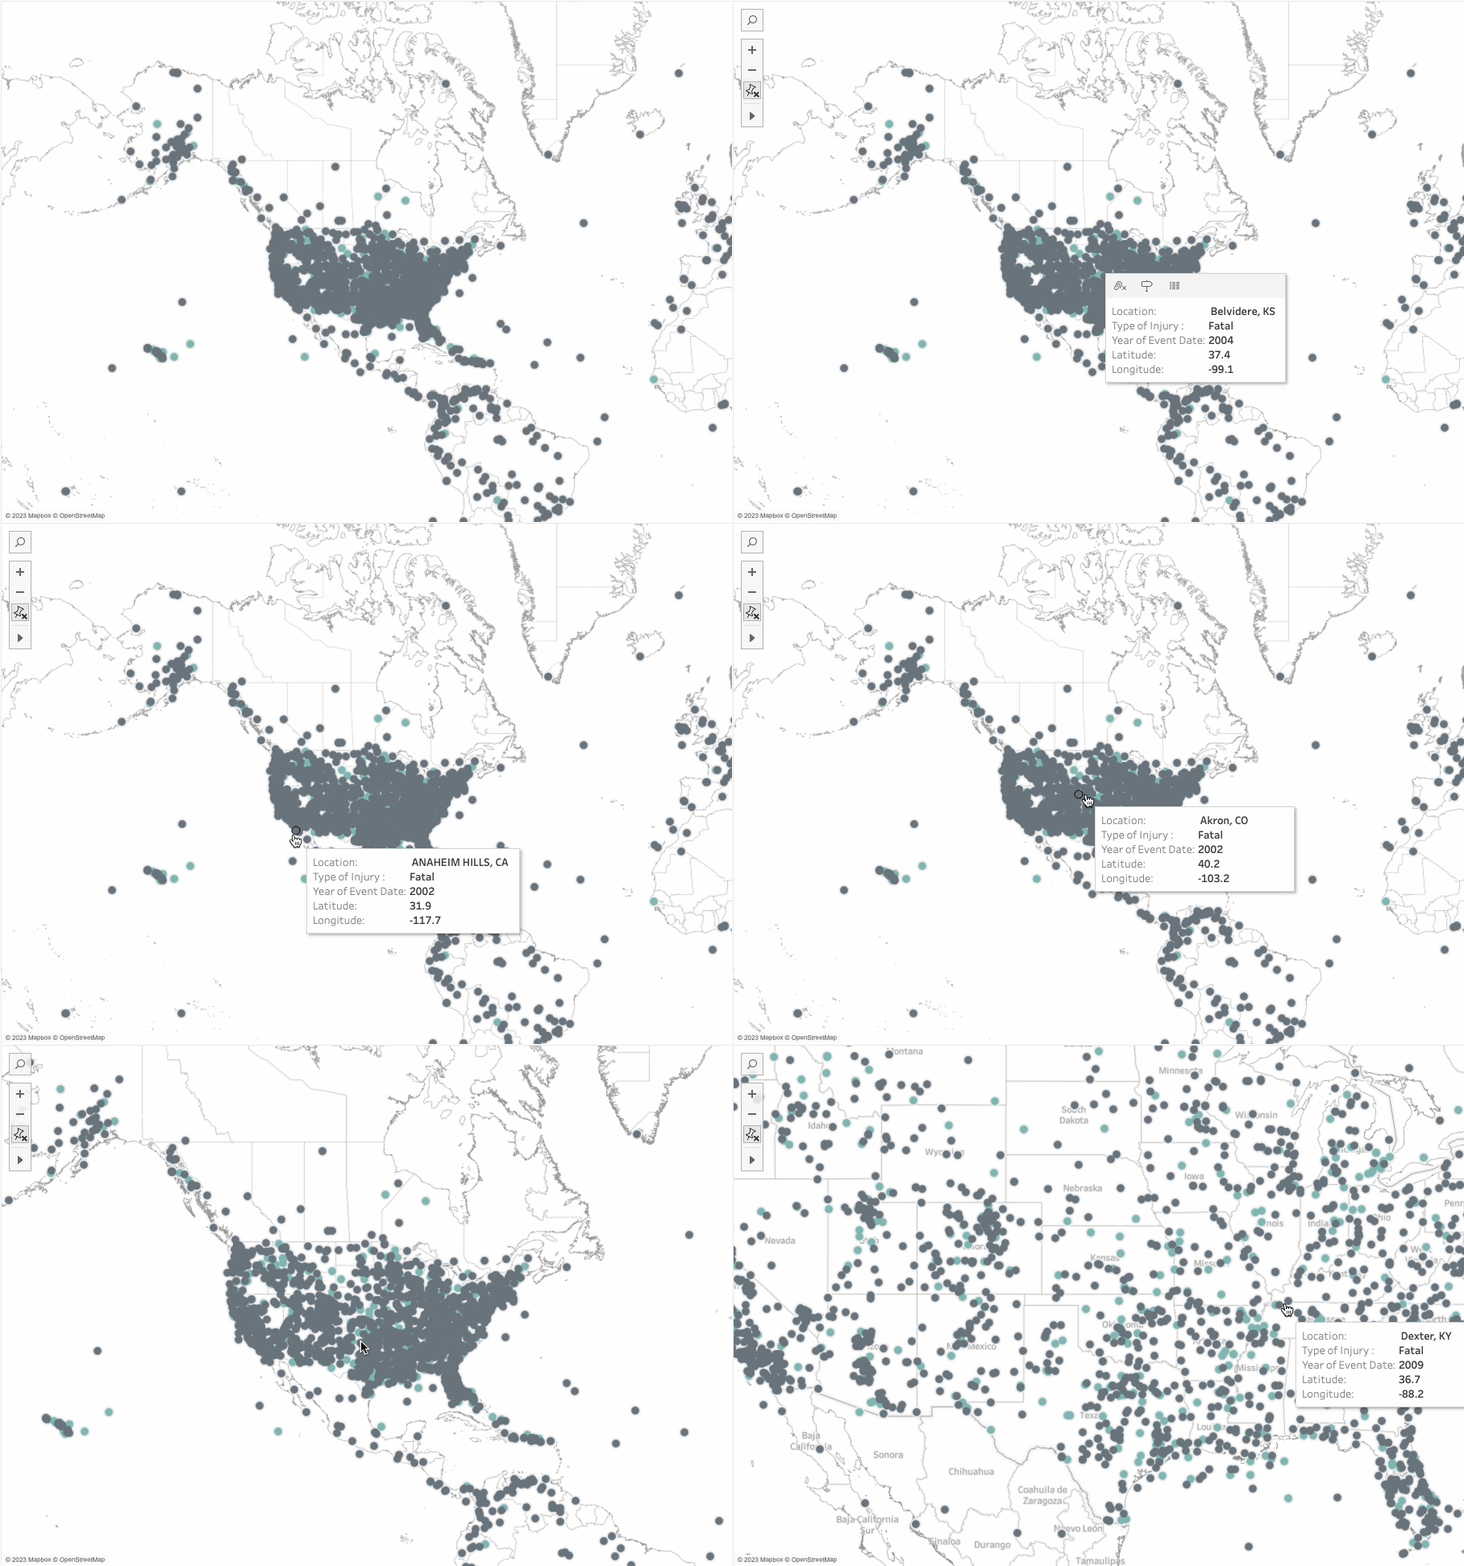
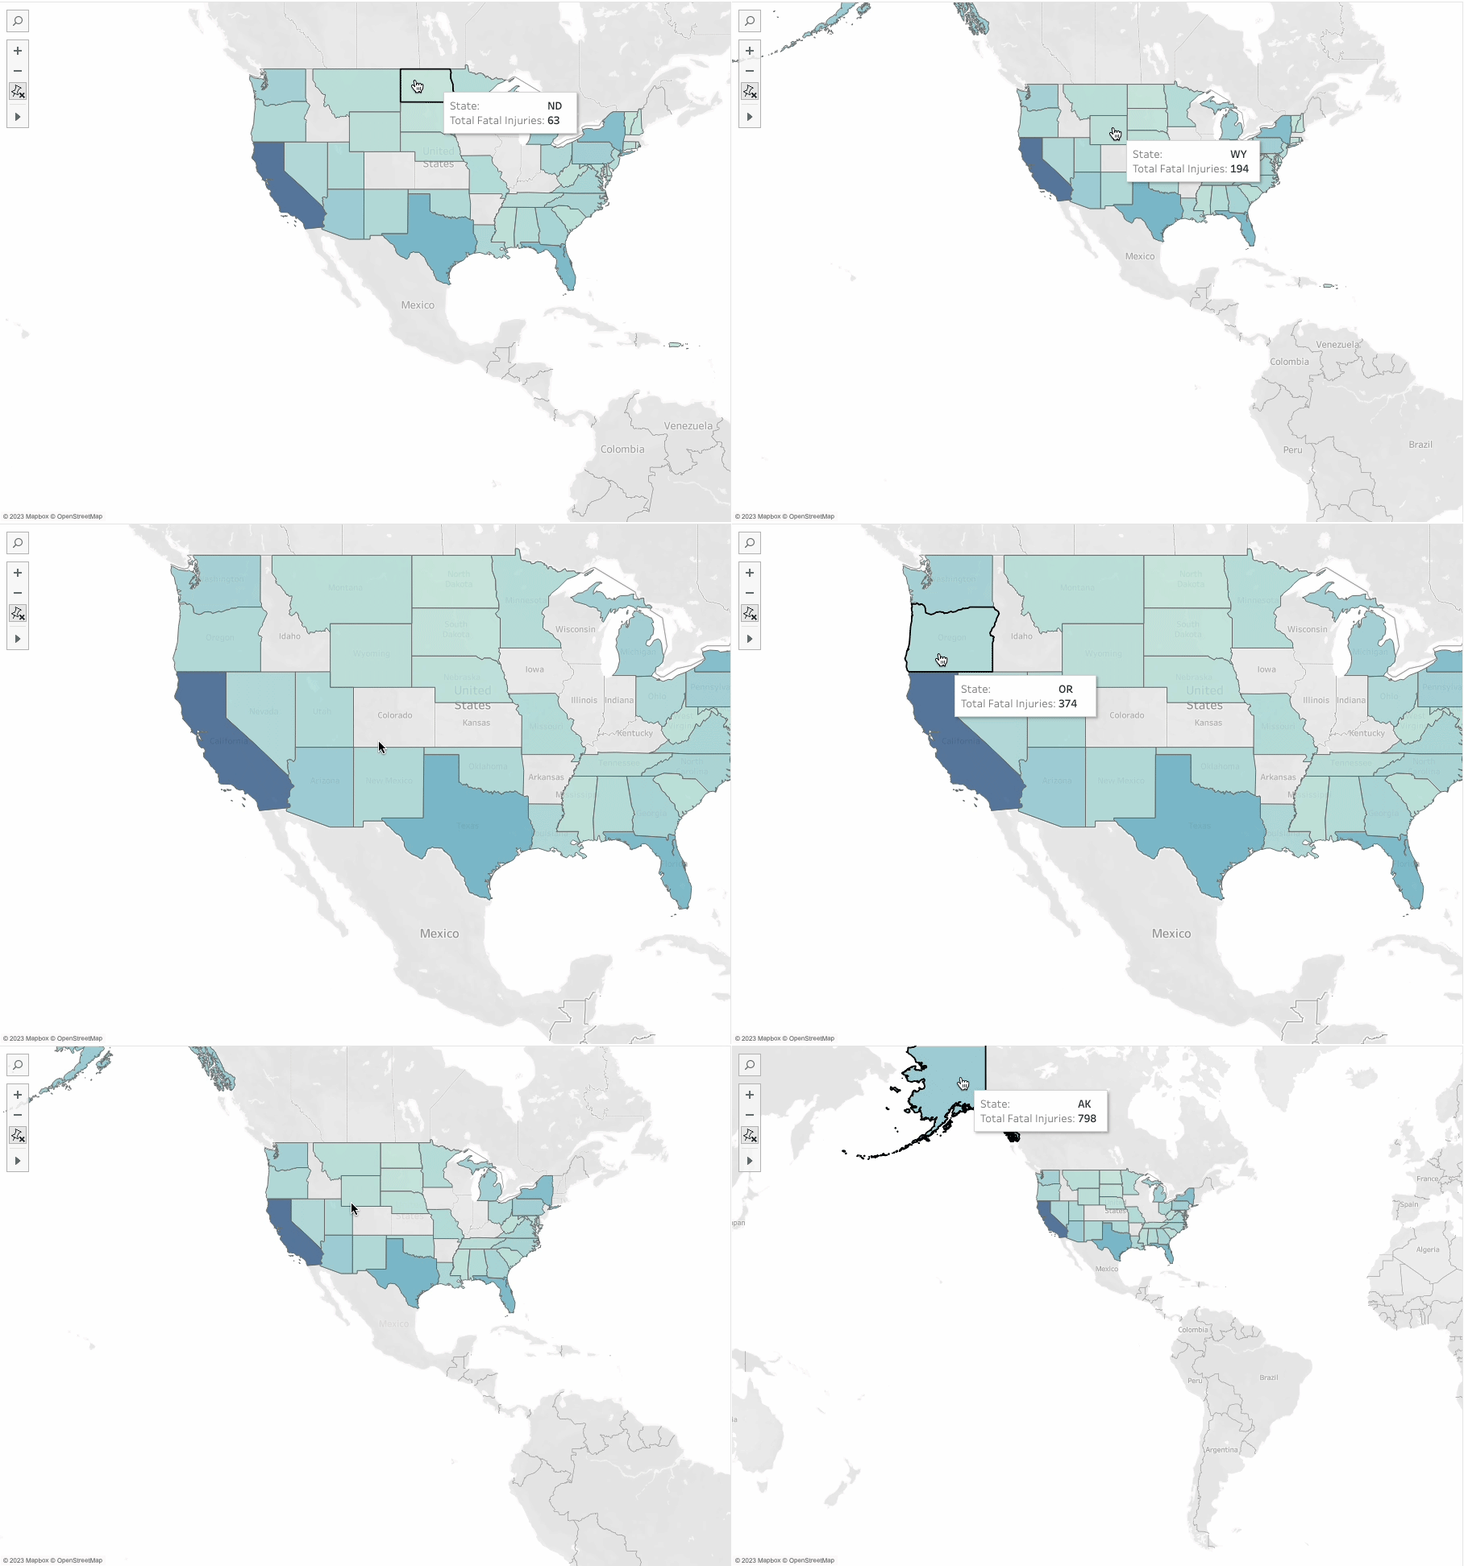
This personal project is a collection of interactive data visualizations. It commenced by harnessing CSV data files to craft dynamic graphics through Tableau.


02.
JAVASCRIPT PROJECTS
Client, Year
Personal, 2023~
Skills
Visual Design, Coding
Tool
JavaScript, p5js
‘Dynamic Cable’ creates an interactive Data visualization of various cable types, enhancing user exploration and learning through dynamic highlighting, color-coded categories, and informative text displays for a visually engaging and educational experience, with a focus on USB-C and Lightning Cable categories and potential expansion in the future.
Audience: General Public
Purpose: The purpose of this data is to provide insights into the evolution of e-waste production over time, with a specific focus on the quantities generated and the contributing factors such as products introduced to the market, recycling output, and overall waste generation. The breakdown by categories aims to offer a comprehensive understanding of the e-waste landscape, facilitating informed decision-making and targeted interventions in waste management and environmental policies.
Summary: This project represents various cable types in a 3D space using JavaScript implementation of UMAP. Users can explore and learn about different cables through an interactive visualization that activates upon hovering. Each cable category is visually distinguished with unique colors, such as yellow for cables and purple for USB-C. The user experience is enriched with dynamic highlighting and informative text displays, offering an engaging and educational approach to understanding cables. The initial focus includes USB-C and Lightning Cable categories, with potential expansion to additional options in the future. Overall, the project aims to define cables in a fun and visually appealing manner, combining interactivity with informative elements.
Inspiration: My interest in the topic of e-waste was sparked by reading the article “Apple’s switch to USB-C could lead to an increase in e-waste.” Link
Process: Implementing u-map in JavaScript presented a significant challenge for me, given my non-computer science background. However, I successfully overcame this hurdle by tapping into educational resources, including the Coding Train video on transformer.js & umap.js. Invaluable insights were gained through discussions with Daniel, particularly regarding image usages, and the initial code he provided proved to be a substantial aid. The implementation process involved starting with clustering text, gradually incorporating one image at a time, and progressively expanding to include more. Ultimately, data was stored in a JSON file. Additionally, multiple debugging sessions played a crucial role in contributing to the overall success of the implementation.